Network issues in Linux
By Cephas Kamuchira on February 1, 2021
BeginnerA beginner's guide to networking troubleshooting in Linux
Every system administrator needs to have at least a basic understanding of network troubleshooting. And the first rule of network troubleshooting to remember is, "Packets don't lie."
"Ethernet switch" by Open Grid Scheduler / Grid Engine is licensed under CC0 1.0
When I worked in a network-focused role, one of the biggest challenges was always bridging the gap between network and systems engineering. Sysadmins, lacking visibility into the network, would often blame the network for outages or strange issues. Network admins, unable to control the servers and fatigued by the "guilty until proven innocent" attitude toward the network, would often blame the network endpoints.
Of course, blame doesn’t solve problems. Taking time to understand the basics of someone’s domain can go a long way toward improving relationships with other teams and shepherding faster resolutions to problems. This fact is especially true for sysadmins. By having a basic understanding of network troubleshooting, we can bring stronger evidence to our networking colleagues when we suspect that the network may be at fault. Similarly, we can often save time by performing some initial troubleshooting on our own.
In this article, we’ll cover the basics of network troubleshooting via the Linux command line.
A quick review of the TCP/IP model
First, let’s take a moment to review the fundamentals of the TCP/IP network model. While most people use the Open Systems Interconnection (OSI) model to discuss network theory, the TCP/IP model more accurately represents the suite of protocols that are deployed in modern networks.
Image
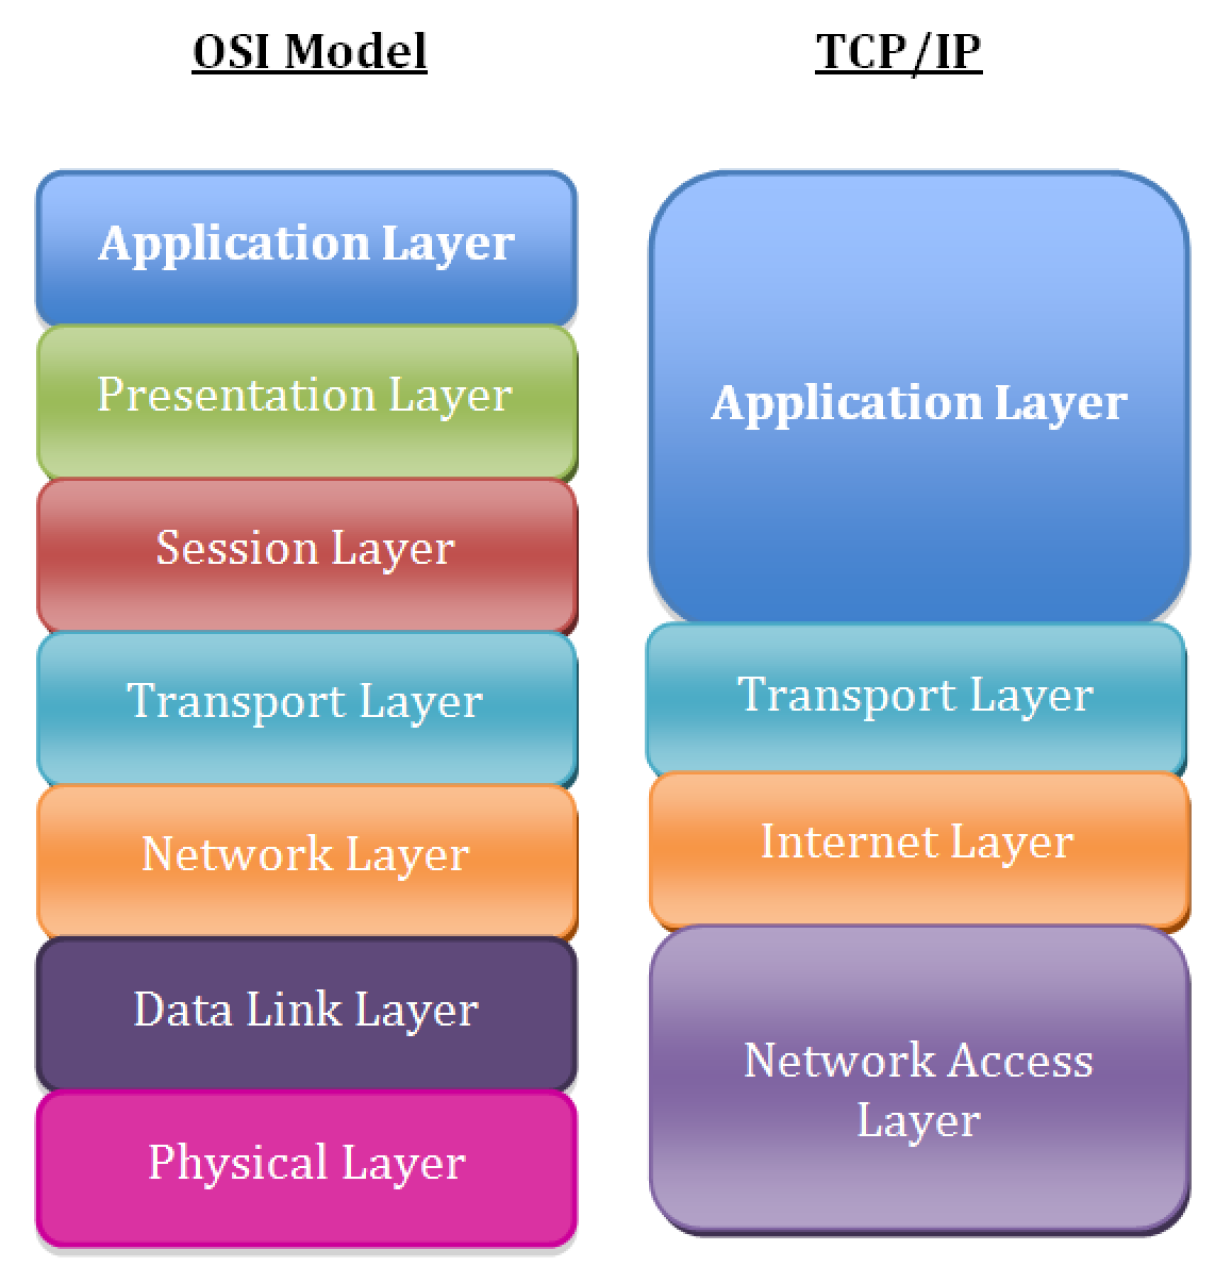
The layers in the TCP/IP network model, in order, include:
- Layer 5: Application
- Layer 4: Transport
- Layer 3: Network/Internet
- Layer 2: Data Link
- Layer 1: Physical
I’ll assume that you are familiar with this model, and will proceed by discussing ways to troubleshoot issues at stack Layers 1 through 4. Where to start troubleshooting is situation-dependent. For example, if you can SSH to a server, but the server can’t connect to a MySQL database, the problem is unlikely to be the physical or data link layers on the local server. In general, it’s a good idea to work your way down the stack. Start with the application, and then gradually troubleshoot each lower layer until you’ve isolated the problem.
With that background out of the way, let’s jump to the command line and start troubleshooting.
Layer 1: The physical layer
We often take the physical layer for granted ("did you make sure the cable is plugged in?"), but we can easily troubleshoot physical layer problems from the Linux command line. That is if you have console connectivity to the host, which might not be the case for some remote systems.
Let’s start with the most basic question: Is our physical interface up? The ip link show command tells us:
# ip link show1: lo: <LOOPBACK,UP,LOWER_UP> mtu 65536 qdisc noqueue state UNKNOWN mode DEFAULT group default qlen 1000link/loopback 00:00:00:00:00:00 brd 00:00:00:00:00:002: eth0: <BROADCAST,MULTICAST> mtu 1500 qdisc pfifo_fast state DOWN mode DEFAULT group default qlen 1000link/ether 52:54:00:82:d6:6e brd ff:ff:ff:ff:ff:ff
Notice the indication of DOWN in the above output for the eth0 interface. This result means that Layer 1 isn’t coming up. We might try troubleshooting by checking the cabling or the remote end of the connection (e.g., the switch) for problems.
Before you start checking cables, though, it’s a good idea to make sure that the interface isn’t just disabled. Issuing a command to bring the interface up can rule this problem out:
# ip link set eth0 up
The output of ip link show can be difficult to parse at a quick glance. Luckily, the -br switch prints this output in a much more readable table format:
# ip -br link showlo UNKNOWN 00:00:00:00:00:00 <LOOPBACK,UP,LOWER_UP>eth0 UP 52:54:00:82:d6:6e <BROADCAST,MULTICAST,UP,LOWER_UP>
It looks like ip link set eth0 up did the trick, and eth0 is back in business.
More Linux resources
- Advanced Linux Commands Cheat Sheet for Developers
- Get Started with Red Hat Insights
- Download Now: Basic Linux Commands Cheat Sheet
- Linux System Administration Skills Assessment
These commands are great for troubleshooting obvious physical issues, but what about more insidious issues? Interfaces can negotiate at the incorrect speed, or collisions and physical layer problems can cause packet loss or corruption that results in costly retransmissions. How do we start troubleshooting those issues?
We can use the -s flag with the ip command to print additional statistics about an interface. The output below shows a mostly clean interface, with only a few dropped receive packets and no other signs of physical layer issues:
# ip -s link show eth02: eth0: <BROADCAST,MULTICAST,UP,LOWER_UP> mtu 1500 qdisc pfifo_fast state UP mode DEFAULT group default qlen 1000link/ether 52:54:00:82:d6:6e brd ff:ff:ff:ff:ff:ffRX: bytes packets errors dropped overrun mcast34107919 5808 0 6 0 0TX: bytes packets errors dropped carrier collsns434573 4487 0 0 0 0
For more advanced Layer 1 troubleshooting, the ethtool utility is an excellent option. A particularly good use case for this command is checking to see if an interface has negotiated the correct speed. An interface that has negotiated the wrong speed (e.g. a 10Gbps interface that only reports 1Gbps speeds) can be an indicator of a hardware/cabling issue, or a negotiation misconfiguration on one side of the link (e.g., a misconfigured switch port).
Our results might look like this:
# ethtool eth0Settings for eth0:Supported ports: [ TP ]Supported link modes: 10baseT/Half 10baseT/Full100baseT/Half 100baseT/Full1000baseT/FullSupported pause frame use: SymmetricSupports auto-negotiation: YesSupported FEC modes: Not reportedAdvertised link modes: 10baseT/Half 10baseT/Full100baseT/Half 100baseT/Full1000baseT/FullAdvertised pause frame use: SymmetricAdvertised auto-negotiation: YesAdvertised FEC modes: Not reportedSpeed: 1000Mb/sDuplex: FullPort: Twisted PairPHYAD: 1Transceiver: internalAuto-negotiation: onMDI-X: on (auto)Supports Wake-on: dWake-on: dCurrent message level: 0x00000007 (7)drv probe linkLink detected: yes
Note that the output above shows a link that has correctly negotiated to a speed of 1000Mbps and full-duplex.
Layer 2: The data link layer
The data link layer is responsible for local network connectivity; essentially, the communication of frames between hosts on the same Layer 2 domain (commonly called a local area network). The most relevant Layer 2 protocol for most sysadmins is the Address Resolution Protocol (ARP), which maps Layer 3 IP addresses to Layer 2 Ethernet MAC addresses. When a host tries to contact another host on its local network (such as the default gateway), it likely has the other host’s IP address, but it doesn’t know the other host’s MAC address. ARP solves this issue and figures out the MAC address for us.
A common problem you might encounter is an ARP entry that won’t populate, particularly for your host’s default gateway. If your localhost can’t successfully resolve its gateway’s Layer 2 MAC address, then it won’t be able to send any traffic to remote networks. This problem might be caused by having the wrong IP address configured for the gateway, or it may be another issue, such as a misconfigured switch port.
We can check the entries in our ARP table with the ip neighbor command:
# ip neighbor show192.168.122.1 dev eth0 lladdr 52:54:00:11:23:84 REACHABLE
Note that the gateway’s MAC address is populated (we’ll talk more about how to find your gateway in the next section). If there was a problem with ARP, then we would see a resolution failure:
# ip neighbor show192.168.122.1 dev eth0 FAILED
Another common use of the ip neighbor command involves manipulating the ARP table. Imagine that your networking team just replaced the upstream router (which is your server’s default gateway). The MAC address may have changed as well since MAC addresses are hardware addresses that are assigned at the factory.
Note: While unique MAC addresses are assigned to devices at the factory, it is possible to change or spoof these. Many modern networks often also use protocols such as the Virtual Router Redundancy Protocol (VRRP), which use a generated MAC address.
Linux caches the ARP entry for a period of time, so you may not be able to send traffic to your default gateway until the ARP entry for your gateway times out. For highly important systems, this result is undesirable. Luckily, you can manually delete an ARP entry, which will force a new ARP discovery process:
# ip neighbor show192.168.122.170 dev eth0 lladdr 52:54:00:04:2c:5d REACHABLE192.168.122.1 dev eth0 lladdr 52:54:00:11:23:84 REACHABLE# ip neighbor delete 192.168.122.170 dev eth0# ip neighbor show192.168.122.1 dev eth0 lladdr 52:54:00:11:23:84 REACHABLE
In the above example, we see a populated ARP entry for 192.168.122.70 on eth0. We then delete the ARP entry and can see that it has been removed from the table.
Layer 3: The network/internet layer
Layer 3 involves working with IP addresses, which should be familiar to any sysadmin. IP addressing provides hosts with a way to reach other hosts that are outside of their local network (though we often use them on local networks as well). One of the first steps to troubleshooting is checking a machine’s local IP address, which can be done with the ip address command, again making use of the -br flag to simplify the output:
# ip -br address showlo UNKNOWN 127.0.0.1/8 ::1/128eth0 UP 192.168.122.135/24 fe80::184e:a34d:1d37:441a/64 fe80::c52f:d96e:a4a2:743/64
We can see that our eth0 interface has an IPv4 address of 192.168.122.135. If we didn’t have an IP address, then we’d want to troubleshoot that issue. The lack of an IP address can be caused by a local misconfiguration, such as an incorrect network interface config file, or it can be caused by problems with DHCP.
The most common frontline tool that most sysadmins use to troubleshoot Layer 3 is the ping utility. Ping sends an ICMP Echo Request packet to a remote host, and it expects an ICMP Echo Reply in return. If you’re having connectivity issues to a remote host, ping is a common utility to begin your troubleshooting. Executing a simple ping from the command line sends ICMP echoes to the remote host indefinitely; you’ll need to CTRL+C to end the ping or pass the -c <num pings> flag, like so:
# ping www.google.comPING www.google.com (172.217.165.4) 56(84) bytes of data.64 bytes from yyz12s06-in-f4.1e100.net (172.217.165.4): icmp_seq=1 ttl=54 time=12.5 ms64 bytes from yyz12s06-in-f4.1e100.net (172.217.165.4): icmp_seq=2 ttl=54 time=12.6 ms64 bytes from yyz12s06-in-f4.1e100.net (172.217.165.4): icmp_seq=3 ttl=54 time=12.5 ms^C--- www.google.com ping statistics ---3 packets transmitted, 3 received, 0% packet loss, time 2002msrtt min/avg/max/mdev = 12.527/12.567/12.615/0.036 ms
Notice that each ping includes the amount of time it took to receive a response. While ping can be an easy way to tell if a host is alive and responding, it is by no means definitive. Many network operators block ICMP packets as a security precaution, although many others disagree with this practice. Another common gotcha is relying on the time field as an accurate indicator of network latency. ICMP packets can be rate limited by intermediate network gear, and they shouldn’t be relied upon to provide true representations of application latency.
The next tool in the Layer 3 troubleshooting tool belt is the traceroute command. Traceroute takes advantage of the Time to Live (TTL) field in IP packets to determine the path that traffic takes to its destination. Traceroute will send out one packet at a time, beginning with a TTL of one. Since the packet expires in transit, the upstream router sends back an ICMP Time-to-Live Exceeded packet. Traceroute then increments the TTL to determine the next hop. The resulting output is a list of intermediate routers that a packet traversed on its way to the destination:
# traceroute www.google.comtraceroute to www.google.com (172.217.10.36), 30 hops max, 60 byte packets1 acritelli-laptop (192.168.122.1) 0.103 ms 0.057 ms 0.027 ms2 192.168.1.1 (192.168.1.1) 5.302 ms 8.024 ms 8.021 ms3 142.254.218.133 (142.254.218.133) 20.754 ms 25.862 ms 25.826 ms4 agg58.rochnyei01h.northeast.rr.com (24.58.233.117) 35.770 ms 35.772 ms 35.754 ms5 agg62.hnrtnyaf02r.northeast.rr.com (24.58.52.46) 25.983 ms 32.833 ms 32.864 ms6 be28.albynyyf01r.northeast.rr.com (24.58.32.70) 43.963 ms 43.067 ms 43.084 ms7 bu-ether16.nycmny837aw-bcr00.tbone.rr.com (66.109.6.74) 47.566 ms 32.169 ms 32.995 ms8 0.ae1.pr0.nyc20.tbone.rr.com (66.109.6.163) 27.277 ms * 0.ae4.pr0.nyc20.tbone.rr.com (66.109.1.35) 32.270 ms9 ix-ae-6-0.tcore1.n75-new-york.as6453.net (66.110.96.53) 32.224 ms ix-ae-10-0.tcore1.n75-new-york.as6453.net (66.110.96.13) 36.775 ms 36.701 ms10 72.14.195.232 (72.14.195.232) 32.041 ms 31.935 ms 31.843 ms11 * * *12 216.239.62.20 (216.239.62.20) 70.011 ms 172.253.69.220 (172.253.69.220) 83.370 ms lga34s13-in-f4.1e100.net (172.217.10.36) 38.067 ms
Traceroute seems like a great tool, but it’s important to understand its limitations. As with ICMP, intermediate routers may filter the packets that traceroute relies on, such as the ICMP Time-to-Live Exceeded message. But more importantly, the path that traffic takes to and from a destination is not necessarily symmetric, and it’s not always the same. Traceroute can mislead you into thinking that your traffic takes a nice, linear path to and from its destination. However, this situation is rarely the case. Traffic may follow a different return path, and paths can change dynamically for many reasons. While traceroute may provide accurate path representations in small corporate networks, it often isn’t accurate when trying to trace across large networks or the internet.
Another common issue that you’ll likely run into is a lack of an upstream gateway for a particular route or a lack of a default route. When an IP packet is sent to a different network, it must be sent to a gateway for further processing. The gateway should know how to route the packet to its final destination. The list of gateways for different routes is stored in a routing table, which can be inspected and manipulated using ip route commands.
We can print the routing table using the ip route show command:
# ip route showdefault via 192.168.122.1 dev eth0 proto dhcp metric 100192.168.122.0/24 dev eth0 proto kernel scope link src 192.168.122.135 metric 100
Simple topologies often just have a default gateway configured, represented by the "default" entry at the top of the table. A missing or incorrect default gateway is a common issue.
If our topology is more complex and we require different routes for different networks, we can check the route for a specific prefix:
# ip route show 10.0.0.0/810.0.0.0/8 via 192.168.122.200 dev eth0
In the example above, we are sending all traffic destined to the 10.0.0.0/8 network to a different gateway (192.168.122.200).
While not a Layer 3 protocol, it’s worth mentioning DNS while we’re talking about IP addressing. Among other things, the Domain Name System (DNS) translates IP addresses into human-readable names, such as www.redhat.com. DNS problems are extremely common, and they are sometimes opaque to troubleshoot. Plenty of books and online guides have been written on DNS, but we’ll focus on the basics here.
A telltale sign of DNS trouble is the ability to connect to a remote host by IP address but not its hostname. Performing a quick nslookup on the hostname can tell us quite a bit (nslookup is part of the bind-utils package on Red Hat Enterprise Linux-based systems):
# nslookup www.google.comServer: 192.168.122.1Address: 192.168.122.1#53Non-authoritative answer:Name: www.google.comAddress: 172.217.3.100
The output above shows the server that the lookup was performed against 192.168.122.1 and the resulting IP address was 172.217.3.100.
If you perform an nslookup for a host but ping or traceroute try to use a different IP address, you’re probably looking at a host file entry problem. As a result, inspect the host file for problems:
# nslookup www.google.comServer: 192.168.122.1Address: 192.168.122.1#53Non-authoritative answer:Name: www.google.comAddress: 172.217.12.132# ping -c 1 www.google.comPING www.google.com (1.2.3.4) 56(84) bytes of data.^C--- www.google.com ping statistics ---1 packets transmitted, 0 received, 100% packet loss, time 0ms# cat /etc/hosts127.0.0.1 localhost localhost.localdomain localhost4 localhost4.localdomain4::1 localhost localhost.localdomain localhost6 localhost6.localdomain61.2.3.4 www.google.com
Notice that in the example above, the address for www.google.com resolved to 172.217.12.132. However, when we tried to ping the host, traffic was being sent to 1.2.3.4. Taking a look at the /etc/hosts file, we can see an override that someone must have carelessly added. Host file override issues are extremely common, especially if you work with application developers who often need to make these overrides to test their code during development.
Layer 4: The transport layer
The transport layer consists of the TCP and UDP protocols, with TCP being a connection-oriented protocol and UDP being connectionless. Applications listen on sockets, which consist of an IP address and a port. Traffic destined to an IP address on a specific port will be directed to the listening application by the kernel. A full discussion of these protocols is beyond the scope of this article, so we’ll focus on how to troubleshoot connectivity issues at these layers.
The first thing that you may want to do is see what ports are listening on the localhost. The result can be useful if you can’t connect to a particular service on the machine, such as a web or SSH server. Another common issue occurs when a daemon or service won’t start because of something else listening on a port. The ss command is invaluable for performing these types of actions:
# ss -tunlp4Netid State Recv-Q Send-Q Local Address:Port Peer Address:Portudp UNCONN 0 0 *:68 *:* users:(("dhclient",pid=3167,fd=6))udp UNCONN 0 0 127.0.0.1:323 *:* users:(("chronyd",pid=2821,fd=1))tcp LISTEN 0 128 *:22 *:* users:(("sshd",pid=3366,fd=3))tcp LISTEN 0 100 127.0.0.1:25 *:* users:(("master",pid=3600,fd=13))
Let’s break down these flags:
- -t - Show TCP ports.
- -u - Show UDP ports.
- -n - Do not try to resolve hostnames.
- -l - Show only listening ports.
- -p - Show the processes that are using a particular socket.
- -4 - Show only IPv4 sockets.
Taking a look at the output, we can see several listening services. The sshd application is listening on port 22 on all IP addresses, denoted by the *:22 output.
The ss command is a powerful tool, and a review of its brief man page can help you locate flags and options to find whatever you’re looking for.
Another common troubleshooting scenario involves remote connectivity. Imagine that your local machine can’t connect to a remote port, such as MySQL on port 3306. An unlikely, but commonly installed tool can be your friend when troubleshooting these types of issues: telnet. The telnet command attempts to establish a TCP connection with whatever host and port you give it. This feature is perfect for testing remote TCP connectivity:
# telnet database.example.com 3306Trying 192.168.1.10...^C
In the output above, telnet hangs until we kill it. This result tells us that we can’t get to port 3306 on the remote machine. Maybe the application isn’t listening, and we need to employ the previous troubleshooting steps using ss on the remote host—if we have access. Another possibility is a host or intermediate firewall that is filtering the traffic. We may need to work with the network team to verify Layer 4 connectivity across the path.
Telnet works fine for TCP, but what about UDP? The netcat tool provides a simple way to check a remote UDP port:
# nc 192.168.122.1 -u 80testNcat: Connection refused.
The netcat utility can be used for many other things, including testing TCP connectivity. Note that netcat may not be installed on your system, and it’s often considered a security risk to leave lying around. You may want to consider uninstalling it when you’re done troubleshooting.
The examples above discussed common, simple utilities. However, a much more powerful tool is nmap. Entire books have been devoted to nmap functionality, so we won’t cover it in this beginner’s article, but you should know some of the things that it’s capable of doing:
- TCP and UDP port scanning remote machines.
- OS fingerprinting.
- Determining if remote ports are closed or simply filtered.
Wrapping up
We covered a lot of introductory network ground in this article, working our way up the network stack from cables and switches to IP addresses and ports. The tools discussed here should give you a good starting point toward troubleshooting basic network connectivity issues, and they should prove helpful when trying to provide as much detail as possible to your network team.
As you progress in your network troubleshooting journey, you’ll undoubtedly come across previously unknown command flags, fancy one-liners, and powerful new tools (tcpdump and Wireshark are my favorites) to dig into the causes of your network issues. Have fun, and remember: The packets don’t lie!
More articles on Linux Admin